
Tutorials
Intermittent FPGA Startup Failures: Build a Repeatable Test
Published · Updated
An intermittent startup problem needs a counting rule before it needs a percentage. Define what a failed start means, when the observation window ends, and how the board is returned to the next starting condition. Otherwise one operator may count a late start as a pass while another counts the same behavior as a failure.
This guide builds a repeatable startup experiment and a raw trial log. The worksheet groups observations by test group, failure phase, off-time and recorded temperature. It retains failures and reports counts as well as percentages. It does not identify a root cause from correlation or qualify a product from a short bench run.
Open the diagnostic worksheet ↓
Define one startup trial and its failure criterion

Choose the first required events. Configuration completion and application readiness should normally be recorded separately. A board can finish configuration yet wait indefinitely for an application handshake. Another board may never reach configuration completion. Combining both into a single “no boot” label discards information needed to choose the next measurement.
Write an explicit deadline and its time origin. For example, a test plan might require a named application response within a specified interval after the supply-enable event. The interval must come from the product requirement or a documented test assumption, not an arbitrary delay chosen after seeing the results. Record late responses separately if they matter to the application.
Define what resets between trials. A software reconnect, a configuration restart and a removal of all relevant power are different operations. If the investigation concerns independent power-on behavior, describe which supplies and external connections remain present during the off interval. A USB or interface connection can matter to the actual starting condition even when the main supply is switched off.
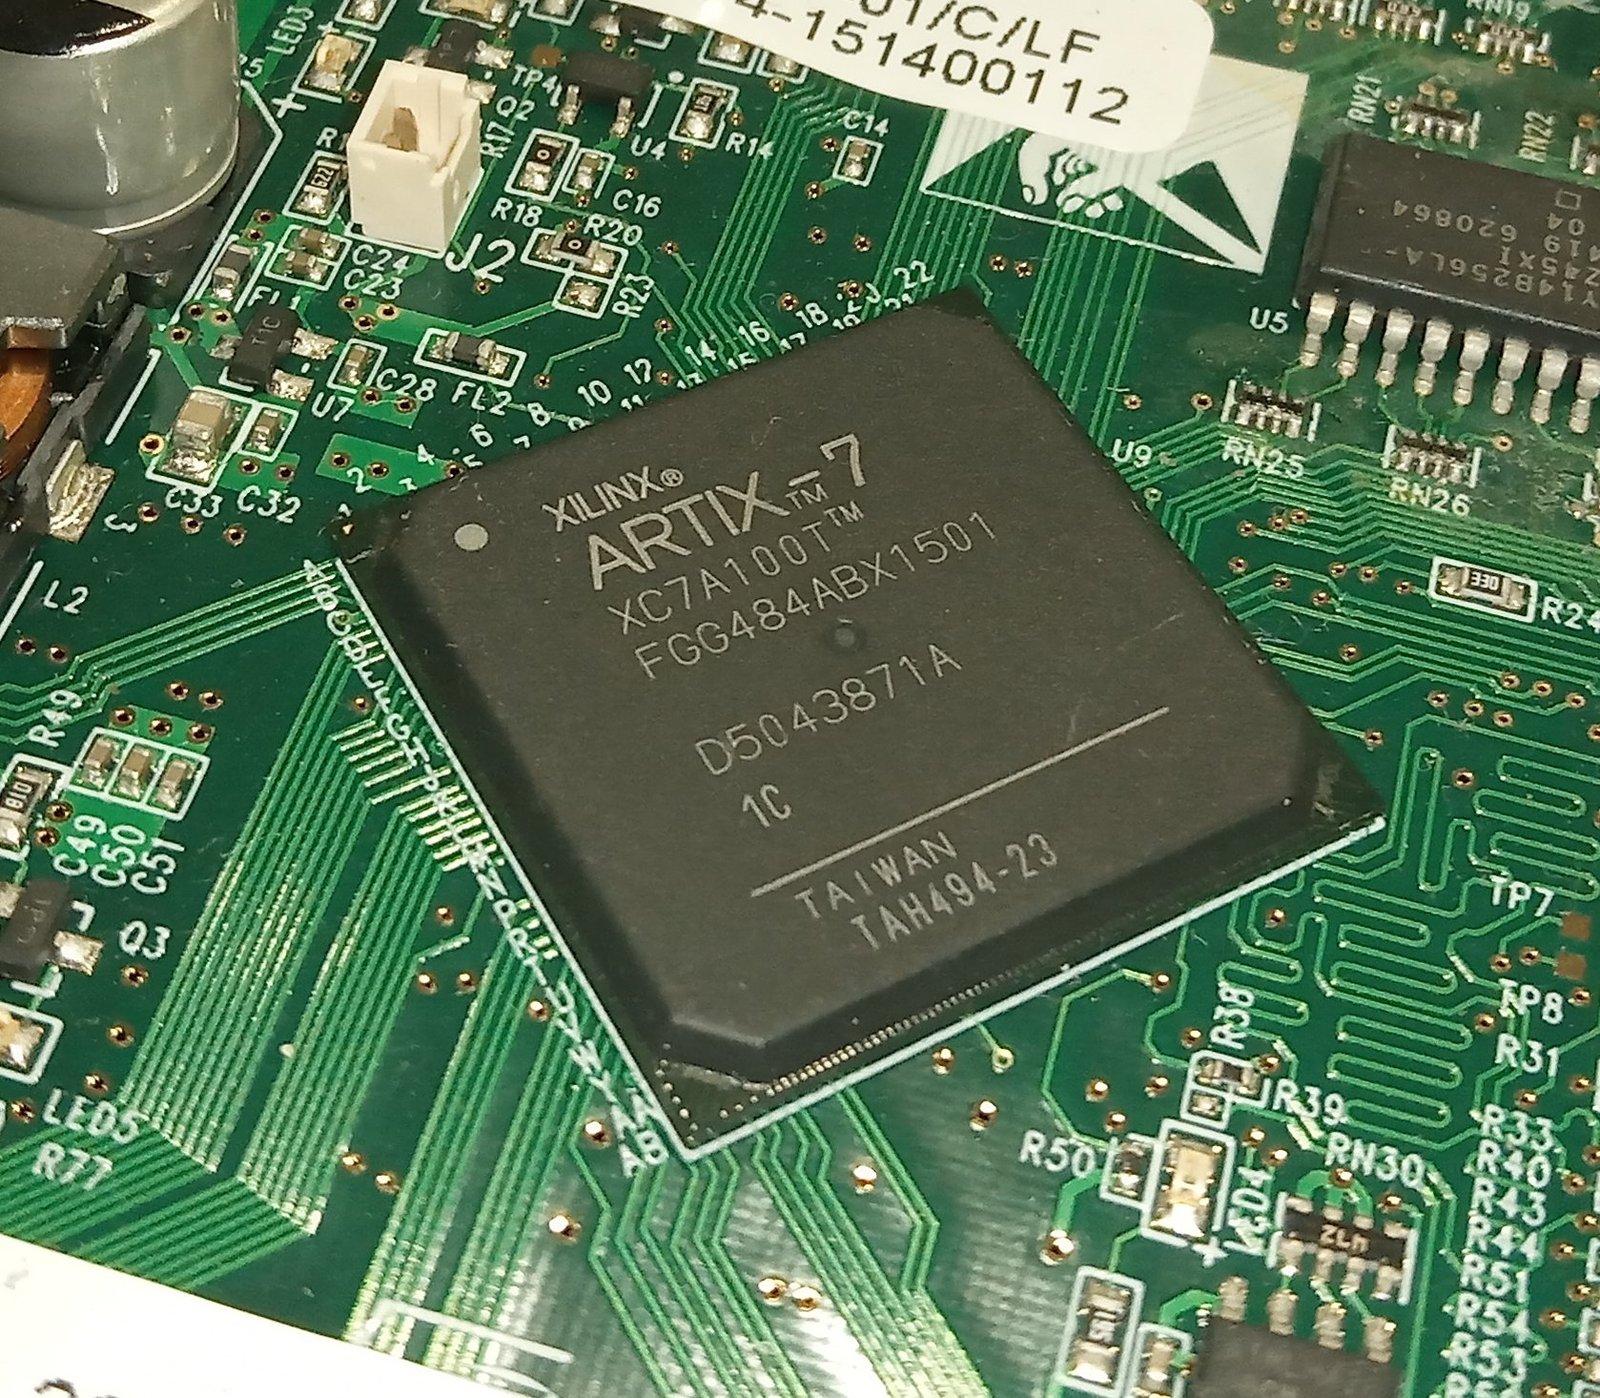
The Artix-7 photograph illustrates the identity information to retain for the board under test; it is not a photograph of a startup-cycling experiment. Record the serial identifier, board revision and fitted device in your own log. The XC7A100T-1CSG324C device page is a package-specific reference, different from the photographed FGG484 part. Do not mix observations from different assemblies under one unnamed group.
Record the image identity too. A build change during a long trial sequence creates a new test group, even if the filename stays the same. Preserve the selected programming file and a runtime identifier where available. Otherwise a change in failure rate may reflect an image change rather than the environmental variable being investigated.
Create a raw row for every trial before summarizing. Include a unique run identifier, time, board identity, image identity, test group, result, failure phase, off interval, power condition, temperature observation and notes. The interactive worksheet uses a compact subset for grouping; retain the richer source log separately. A summary should always be traceable back to individual attempts.
Decide how interrupted trials are handled. A disconnected probe, operator interruption or logging failure should not silently become a pass or disappear from the history. Mark it as an excluded or incomplete trial with a reason in the raw log, then exclude it explicitly from the pass/fail subset entered into this worksheet. The tool only accepts completed pass/fail rows and cannot infer why a missing trial was omitted.
Keep starting conditions consistent and capture the failure phase
Specify the power-cycle procedure in enough detail to repeat it. Record the supply settings, switching method, off interval and any observed rail behavior relevant to the starting condition. A timed off command does not prove that every rail reached the same state. If discharge behavior is part of the hypothesis, measure it using the board’s approved test points and suitable equipment rather than assuming that elapsed time alone establishes it.
Keep external connections fixed within a group. A debugger, host interface, sensor supply or fixture contact can change the board’s conditions. If one connection is intentionally removed, start a new group and record the change. Avoid discovering halfway through the test that some trials had a debugger attached and others did not, with no way to identify which rows belong to each setup.
Record temperature honestly. Ambient temperature, chamber setpoint, board sensor reading and device junction estimate are different quantities. Use a clear label and retain the observation method in the notes. The worksheet groups by the numeric temperature entered; it does not establish thermal equilibrium or convert a room reading into a die temperature.
Capture the earliest failed stage that the instrumentation can support. Useful categories can include initialization, configuration loading, startup, application readiness and external communication. Leave the phase unresolved if the available observations cannot distinguish them. A broad unknown category is more accurate than assigning every dark LED to configuration failure.
For Artix-7, retain configuration-related pin or status observations with their timing. The flash-boot troubleshooting article explains why direct JTAG configuration and independent flash boot are separate paths. Do not insert a JTAG download into a failed independent-boot trial and then record the recovered board as if the original power-on attempt passed.
Use matched success and failure captures when possible. Keep probe placement, trigger and acquisition window the same. Look for the first reproducible divergence rather than searching only the final inactive state. A later symptom may be a consequence of an earlier missing event. Preserve both captures so another reviewer can check whether the proposed divergence is actually supported.
When changing one condition, keep a baseline comparison nearby in time. A sequence such as baseline, changed condition, baseline again helps reveal drift or accumulated state. If the final baseline no longer behaves like the first, the experiment has not isolated only the intended variable. Investigate the changed background conditions before assigning causation to the experimental setting.
The PCB bring-up checklist provides context for power, reset and test-access evidence. Use it to resolve missing measurements, not to add unrelated changes during an ongoing trial block. Once a block begins, stop and label a new group if the setup must change. This keeps the statistics attached to an identifiable experiment.
Automated cycling needs an explicit recovery rule. If a failure requires manual intervention, record that intervention and whether subsequent trials are comparable. A fixture that automatically retries until a board responds can hide the first-attempt failure rate. Keep initial attempts and recovery attempts separate when startup reliability or operator workload is the question.
Group the raw rows and choose a controlled follow-up

Show the diagram with each evidence item highlighted
The highlight moves between the same four items. It does not represent elapsed hardware time. Close this disclosure to hide motion; the static diagram contains the same information.
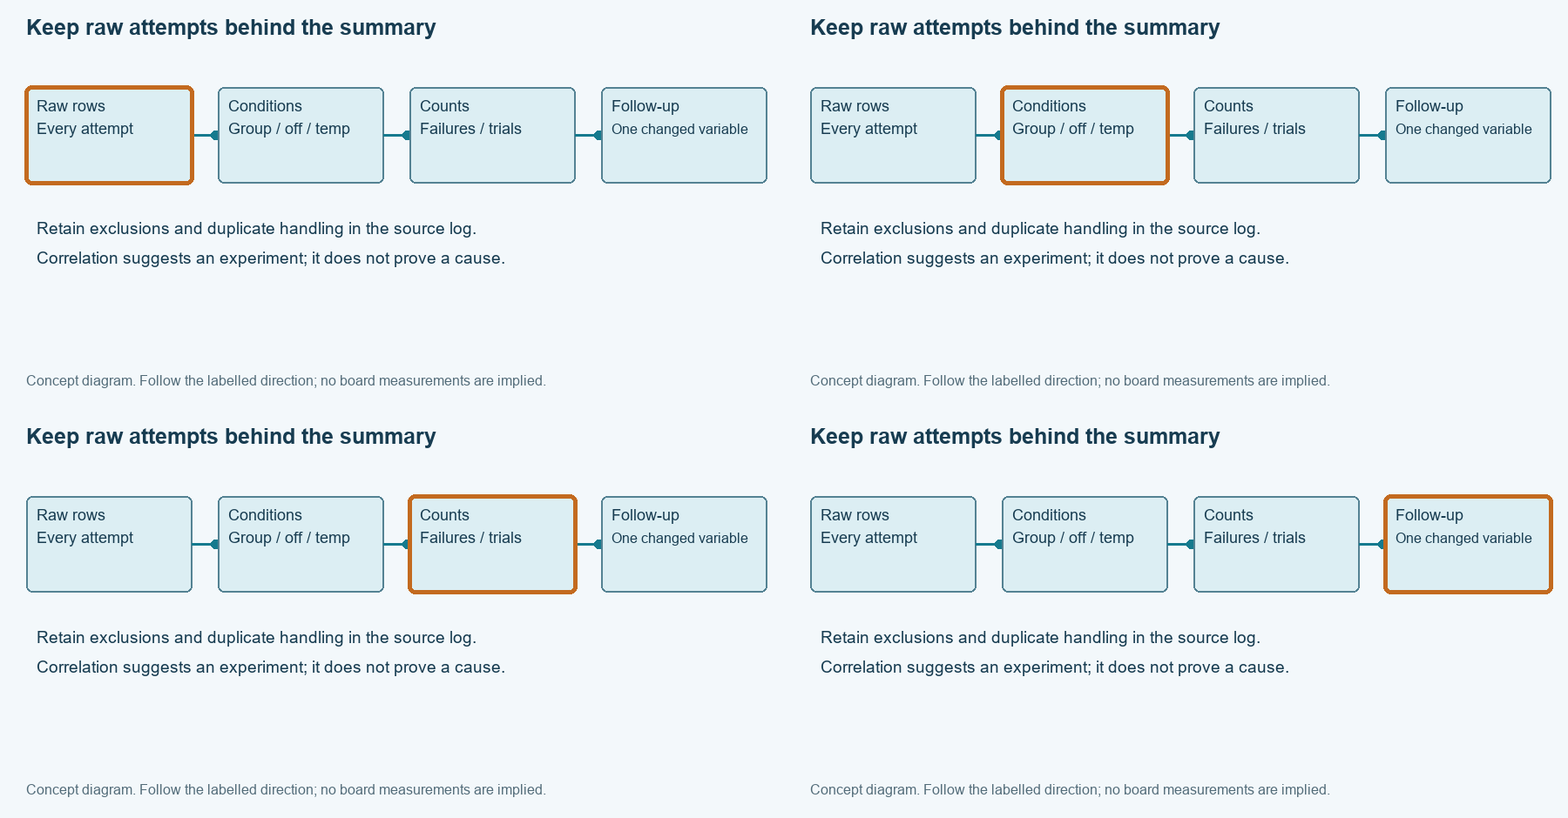
Enter completed trials as group, result, phase, off seconds and temperature, separated by vertical bars. The result must be pass or fail. Use a consistent phase vocabulary and preserve the meaning of the temperature measurement in the notes. The worksheet rejects incomplete rows rather than quietly dropping missing values from the denominator.
Grouping includes all four condition labels: group, phase, off-time and temperature. This avoids silently combining a short-off trial with a long-off trial merely because both share a group name. It also means phase-specific rows remain separate. If an overall rate is needed, calculate it from the complete raw data using a clearly stated grouping rule rather than treating one subgroup as representative of the whole experiment.
For a hypothetical example, three failures in thirty completed trials is an observed failure fraction of ten percent. That is a description of those thirty trials. It is not a prediction that every next set of thirty will contain exactly three failures. The example illustrates counting only; no hardware measurements are claimed here.
Duplicate input rows are counted as separate trials because repeated conditions are legitimate. The tool cannot distinguish a real repeated attempt from an accidental paste duplication. Use unique identifiers in the original log and reconcile the entered subset before exporting. Keep the original CSV or laboratory record as the source of truth, and use the worksheet output as a summary linked to it.
Do not remove an inconvenient failure after changing the hypothesis. If a trial is excluded for a documented instrumentation problem, retain its row and the exclusion reason in the source log. Report both the completed-trial count and any exclusions when discussing the experiment. Otherwise a clean summary can conceal a test that was difficult to perform reliably.
A follow-up experiment should discriminate between plausible explanations. If failures correlate with a shorter off interval, test that condition under a controlled power setup while keeping the image and connections fixed. The correlation alone does not prove residual charge or a particular reset problem. Define the additional observation that would support that physical explanation before collecting more counts.
For a recurring process, the fixture design guide helps define timing, retained evidence and recovery behavior. Include the acceptance rule and raw-log format in the fixture revision. A later fixture software change can alter what is counted as a failure even when board behavior is unchanged.
Without JavaScript, group the same rows in a spreadsheet and calculate failures divided by completed attempts. Keep counts alongside percentages and retain unknown phases. For an engineering discussion, share the exported summary, raw trial log, setup diagram and the specific follow-up question. The useful outcome is a better-controlled experiment that can establish a cause, rather than a percentage presented as an explanation.
Enable JavaScript for the local worksheet, or use the manual record procedure in the article. No data is submitted automatically.
Use the record for the next engineering decision
Review and download the worksheet above. For board-level help, open the engineering scope entry and include the exact board revision, observed failure and unresolved check. For an exact-part enquiry, use the component quotation entry with the complete ordering code and quantity. Opening either entry does not submit a request.
Reference scope
Prepared for the specific diagnostic task shown above. Source checks: 2026-11-14. UG470 references use v1.17; cited UG908 task pages were checked as 2026.1 where stated. Hardware commands and board behavior require verification in the actual setup. Concept figures and hypothetical examples are not measured test results.